

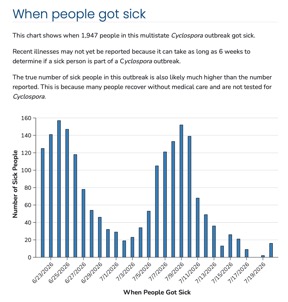
Phyllis Entis published something at eFoodAlert on Sunday that anyone covering this outbreak should read before they write another word about it. She looked at the epidemic curve CDC finally posted on July 24 and saw two things nobody else had said out loud. The curve begins right at a peak. And it has twin peaks. Then she asked the question that matters, which is why.
She also did the work that makes the question answerable. She set CDC’s new curve beside the agency’s own Cyclospora curves from 2019 and 2020, both from leafy green outbreaks, and both of them behave the way outbreak curves behave: a few cases, then acceleration, then a peak, then a fall. Her sentence about it is the one to keep. “An outbreak does not burst onto the scene at the peak of its strength.”
Start with the shape. Read the bar heights off CDC’s chart and they sum to 1,946 against the agency’s stated 1,947, so the numbers below are essentially the published ones. The first peak crests on Wednesday, June 24, at 157 cases. The curve falls to 19 on Thursday, July 2. It climbs back to 152 on Thursday, July 9. Split it at the trough and this outbreak divides into 946 cases and 1,000 — a near-even halving of the total, fifteen days apart.
Phyllis offers three possibilities for the twin peaks: a lag in state reporting, a lag in collation at CDC, or the peaks are real. Here is what narrows it. In most outbreaks of intestinal illness, a second hump is secondary transmission — the first wave of sick people infects a second. Cyclospora cannot do that, and Phyllis explains exactly why in her own opening paragraphs. The oocysts come out of a sick person in an inactive form and need days in the environment before they can infect anyone, and the human gut is the only place this parasite lives. Nobody in this outbreak caught it from another person. A second wave therefore requires a second exposure. There is no third possibility.
Then there is the front of the curve, and this is where her reporting and my complaining meet. CDC’s first notice on July 14 put the earliest illness onset on June 22. On July 17 the agency moved it to May 13. On July 24 it moved back to June 22. Out forty days and back again, with no explanation attached to either move.
In that same July 24 update, the confirmed count went from 1,644 people in five states to 1,947 in nine, and Michigan fell from 1,141 cases to 931. At least 210 people who were part of this outbreak on July 17 were not part of it on July 24. Since the national number rose by 303 while four states were added, the gross additions were at least 513. None of those Michigan patients stopped being sick. They stopped being counted.
And here is the point Phyllis makes almost in passing, which I think is the sharpest thing written about this outbreak in a week. We cannot see what was removed. CDC had no epidemic curve on July 17, when the range still began May 13. It published its first one on July 24, by which time the range began June 22. The only document that would let anybody count the removed cases starts the day after the removed period ends. The missing ascending limb she noticed is not missing from the outbreak. It is missing from the chart.
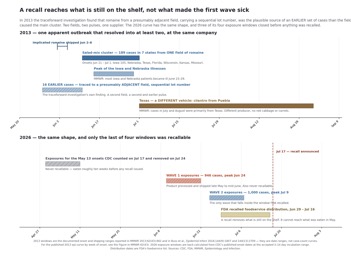
CDC’s 1,947 cases with the removed period shown, the two waves separated at the July 2 trough, and exposure windows back-calculated against FDA’s distribution dates. Bar values read from CDC’s published curve.
The timing is why that matters. Cyclospora takes two to fourteen days to make you sick, a week on average. Work backward and the first wave was exposed around June 17 and the second around July 2. FDA says the recalled foodservice lettuce shipped from June 29 through July 16. The second wave sits inside that window. The first wave comes before it. And the May 13 illnesses CDC took out of the count were exposed somewhere around April 29 to May 11 — roughly seven weeks before the recalled lettuce ever left the plant.
One more thing about which cases went. CDC’s own caveat, printed under its curve, is that it can take six weeks to determine whether a sick person belongs to an outbreak. The May illnesses had been in the system about ten weeks by July 24. They were the most thoroughly worked-up cases the agency had. The July illnesses are still inside the lag and are the least. The revision removed the ripe cases and kept the green ones.
There is an explanation for that first wave that does not require a second supplier, and it belongs on the table. A recall reaches what is still in commerce. FDA’s June 29 to July 16 window is the window of lettuce still sitting on shelves and in walk-in coolers when Taylor Farms announced on July 17. It is not the window of contaminated production. Shredded iceberg runs about two weeks of shelf life. The lettuce that made the first wave sick was processed and shipped somewhere between late May and mid-June, and it had been eaten and thrown out long before anybody drafted a recall notice. The May illnesses CDC deleted were eaten roughly ten weeks before. No recall could have reached either one, however contaminated it was. And on July 18 Taylor Farms did not suspend one product line. It suspended all production at Doctor Mora, which is what a company does about a plant, not about a lot.
That explains the front of the curve. It does not by itself explain the trough. Contamination running steadily through a season produces a long plateau, not two peaks with a hole between them. To get twin peaks fifteen days apart out of a single supplier, you need contamination that arrives in pulses — separate fields, or separate harvest blocks, moving through the same plant at intervals.
Which is exactly what happened the last time. We have seen a Cyclospora curve with two humps turn into two outbreaks before, and the same company was in the middle of it. In the summer of 2013, 631 people in 25 states looked like one event and resolved into at least two. The clusters at Olive Garden and Red Lobster in Iowa and Nebraska were traced to bagged salad mix from Taylor Farms de Mexico in Doctor Mora, Guanajuato. Texas reported 278 cases, and at least 25 of those — a cluster at one Fort Bend County restaurant — were linked to cilantro out of Puebla, from a different producer, with no connection to Taylor Farms.
Now look at what the traceforward investigation found inside the salad-mix half of it. Romaine shipped on June 2 through 6 from a single Mexican field likely caused 189 illnesses across seven states. And a presumably adjacent field, carrying a sequential lot number, was the plausible source of sixteen earlier cases. Two fields side by side, harvested days apart, producing two pulses of illness out of one supplier. The regional investigation found the same thing from the other direction: the implicated salad mix drew its romaine from two separate single-grower fields plus at least one more field from another grower. When this parasite produces a curve with two humps, the historical answer has been more than one vehicle — and sometimes more than one field inside a single vehicle.
The 2013 and 2026 windows side by side. The 2013 bands are the documented onset and shipping ranges from MMWR and the two published investigations, not case-count curves; CDC’s own 2013 epi curve by week of onset is the Figure in MMWR 62(43):862.
If that is what happened again, then this recall was under-inclusive by construction. It could only ever remove what was still on the shelf. And CDC’s June 22 cutoff then excludes precisely the people whose lettuce was never recallable in the first place. The case definition and the recall window now agree with each other, and both of them sit downstream of the date a company chose to make an announcement.
Phyllis found something else in the same post that deserves its own week of attention. CDC’s surveillance tablegives Ohio a range of 301 to 500 cases while the outbreak notice credits Ohio with 639. West Virginia gets 11 to 30 in the surveillance table and 42 in the outbreak. The outbreak is a subset of the surveillance total. A subset cannot be bigger than the thing it is part of. She also asks why an agency that adds up state counts to produce a national figure is publishing those state counts as ranges instead of numbers. I would like to hear the answer to that one too, and I would like to hear it alongside an explanation of why Cyclospora reporting through FoodNet went from mandatory to optional on July 1, 2025.
Meanwhile Michigan reported 71 new cases in the week ending June 27, then 496, then 1,329, then 3,593 in the week ending July 18 — its biggest week of the outbreak — during the same days CDC’s curve drops to single digits. Those are different clocks, and it is only fair to say so: Michigan counts by the date a case is reported and CDC by the date somebody got sick. But only 1,947 of the roughly 15,500 cases the states are reporting are inside CDC’s outbreak count at all.
Five questions, and every one of them has an answer sitting in a federal database right now. How many cases in total came out when the earliest onset moved back to June 22, and what were their onset dates? Will CDC publish the curve for May 13 through June 21 that it never published in the first place? What changed in the case definition between July 17 and July 24, and was the change applied backward to people already counted? And have the two peaks been compared by genotype? CDC has been running targeted sequencing on Cyclospora since 2018 for precisely this purpose — to pull apart clusters that look like a single outbreak. If those two humps carry different genotypes, they are not two waves. They are two outbreaks. And fifth, has anybody run the first wave back to a lot code? If a single one of those cases traces to Doctor Mora product shipped before June 29, then the recall never covered the first half of this outbreak.
Phyllis ended by saying we will have to wait and see. I understand why she wrote it that way, and she is more patient than I am. The people in that grey box on the chart above have been waiting since the middle of May, and somebody at CDC already knows how many of them there were. Read her post. She saw it first, and she asked the right question.